Growth Strategy
January 26, 2024
February 17, 2023
.png)

.png)
Quick summary:
You can't rely on experts, opinions and conventional wisdom. It's shocking how often they're wrong. While qualitative research and behavioral can data point you in the right direction, you want to run controlled tests (aka split tests) if you want to know what works. Even better, look for patterns across many tests (meta-analysis) to understand what drives results by sector, page, geography, etc.
Meta-analysis is the gold standard in science, but until now no one has had data on similar tests across every brand in a sector. Our test detection engine has now unlocked over 1,000,000 pieces of data on tests that we use to do meta-analysis. So you can finally discern what is likely to move the needle before you run any tests of your own.
We find that meta-analysis drives wins, but context matters. For example, what works in one industry does not necessarily work across industries. You need to look for patterns by sector, page, location on page, geography etc to draw the right lessons from others tests.
Below we walk you through the types of evidence you can use and how to use meta-analysis to drive results.
Are apples bad for you?
There’s a doctor on Instagram (Dr. Steven Gundry) who runs ads claiming they are.
It’s a bold claim. Should you believe it?
Well, he is a doctor who speaks with authority. He also points to evidence of how his approach helped his patients. But how do you know if his claims are valid?
Thankfully, doctors have a way of determining how much confidence you should put in a theory like this one. It’s called the Hierarchy of Evidence. Doctors use it to rank the general validity of research findings based on the type of evidence that supports it.
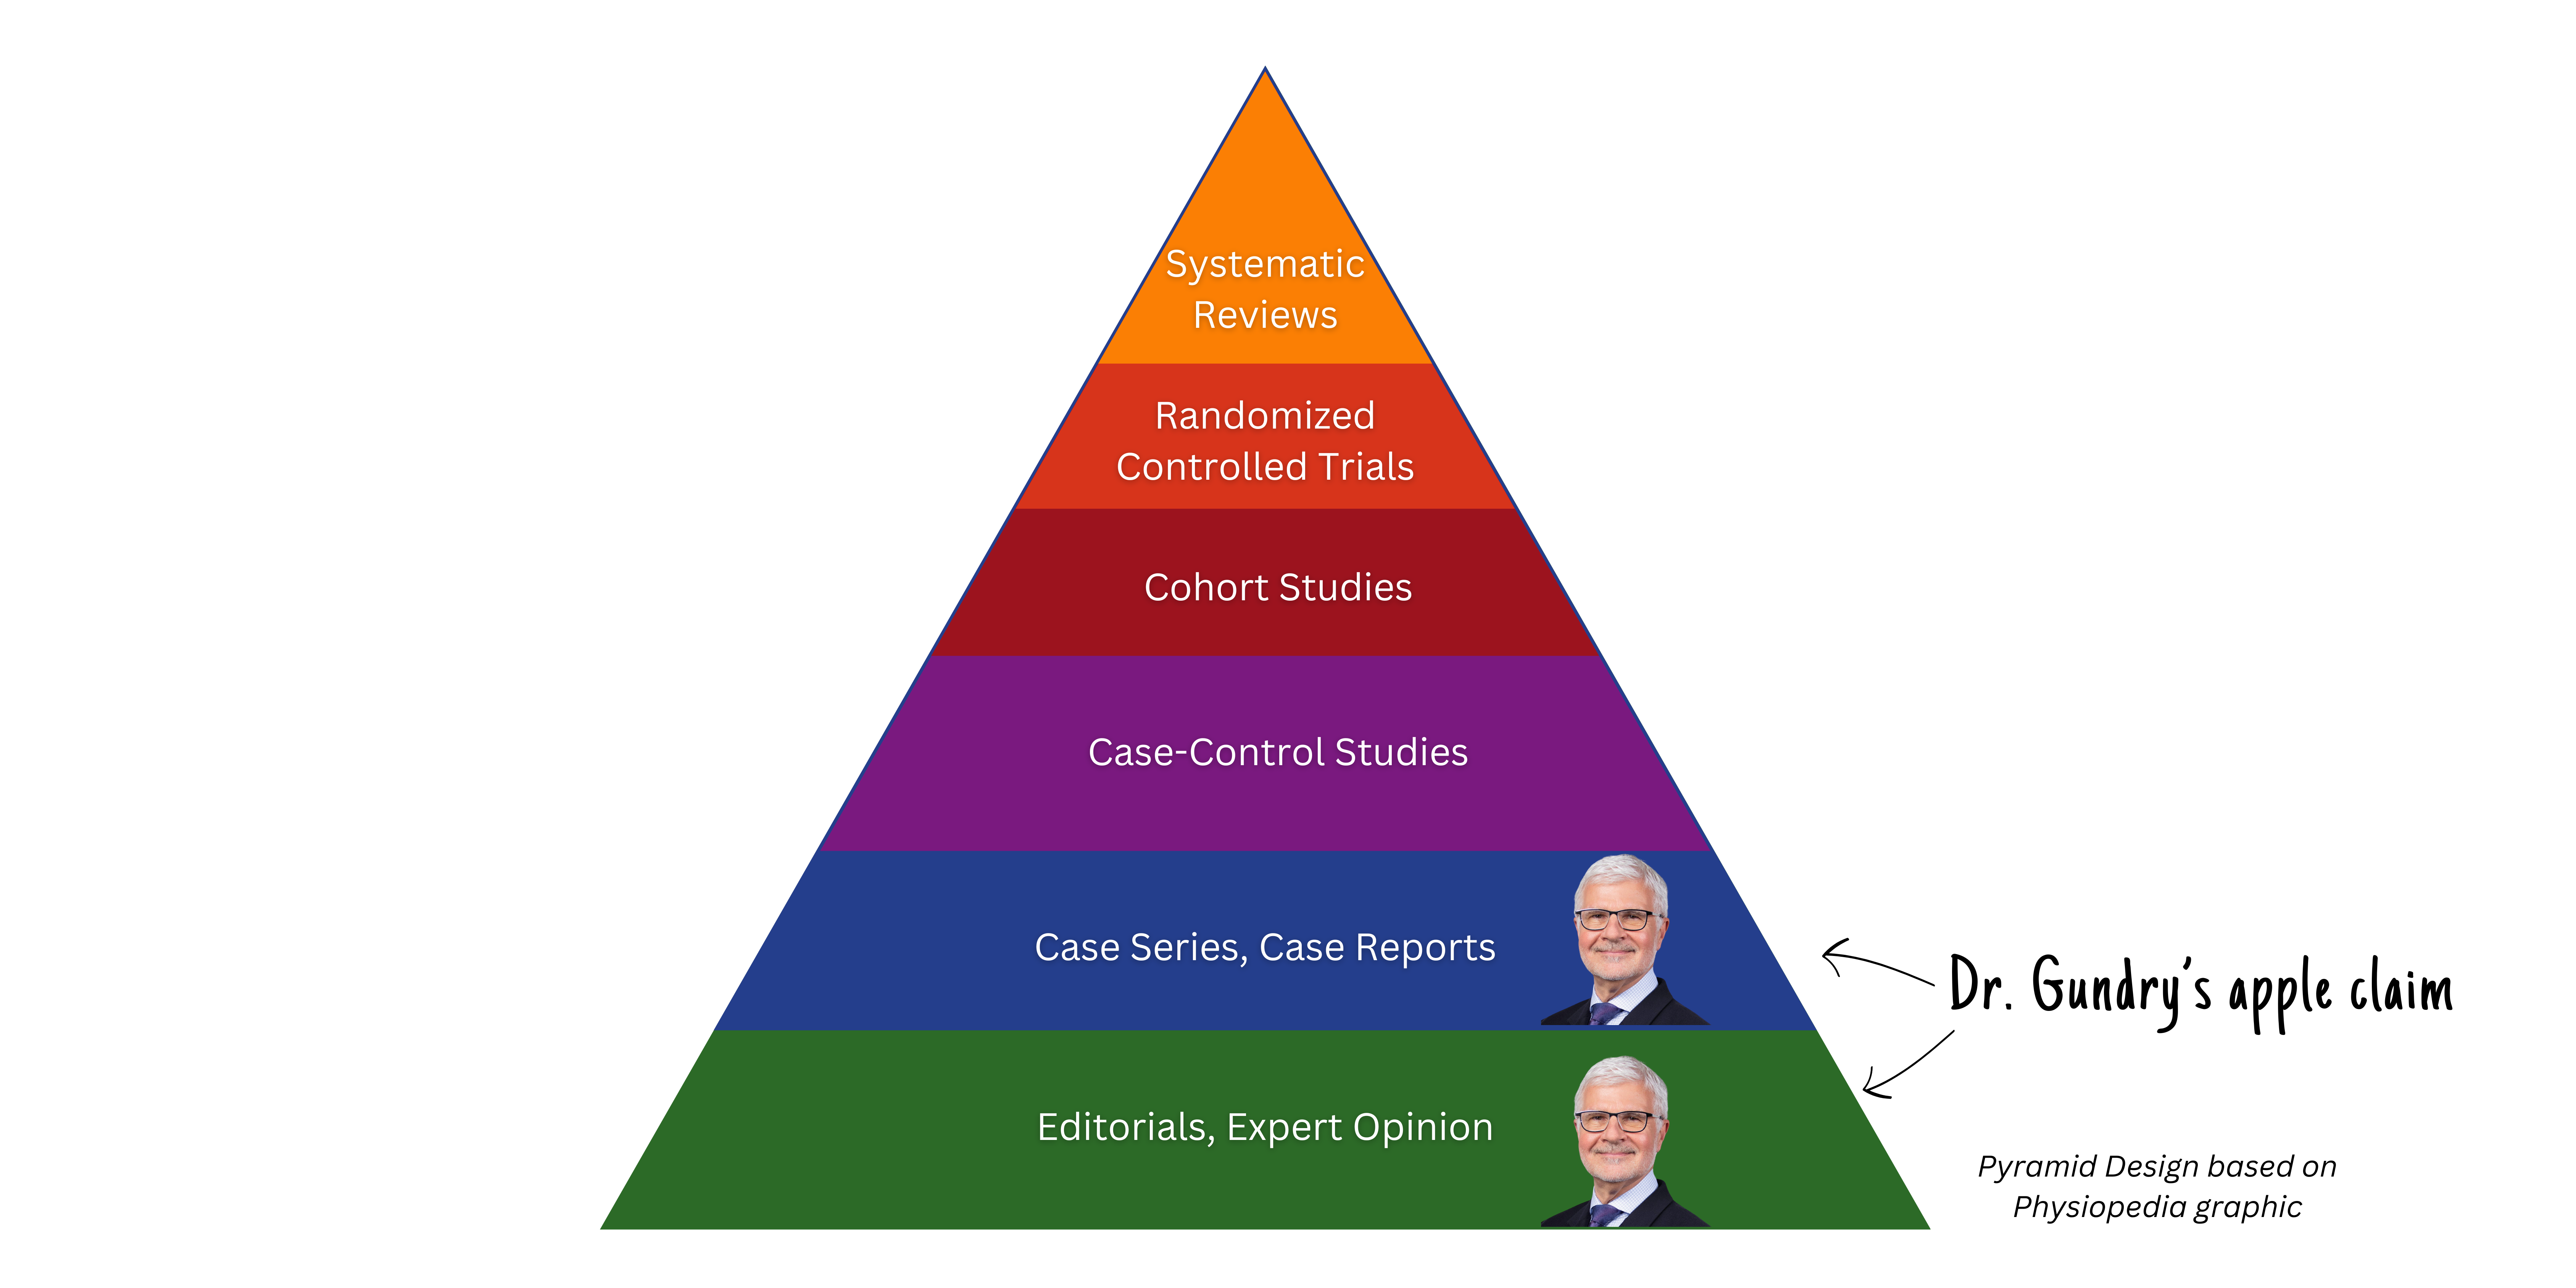
Each level of the pyramid builds on the levels below it. Methods toward the top of the pyramid produce findings that are most likely to be true when generalized. They are also the most expensive and hardest to obtain.
Using the framework, you see that Dr. Gundry’s apple theory has directional support given his medical expertise (Level 1) and the one-off examples from patients (Level 2). But it lacks higher level sources like randomized controlled tests or systematic reviews (Levels 5-6). So it would be wise to take it with a grain of salt (or maybe salted peanut butter for the apples) until his findings are tested further.
Erin Weigel and Lucas Bernardi recently applied the Hierarchy of Evidence to user experience. It inspired us to do a deep dive iterating on how this framework can help you drive growth.
Just as doctors want to use evidence to fix what ails their patients, growth and product teams want to use evidence to figure out how to improve their user experience.
Let’s say you want to optimize a key landing page. You spend tons of money getting people to the page and want as many to convert as possible.
Conventional wisdom would suggest adding something like social proof (ratings, logos, press, testimonials, endorsements, etc.), but is it worth the effort? If so, what’s the best way to implement it?
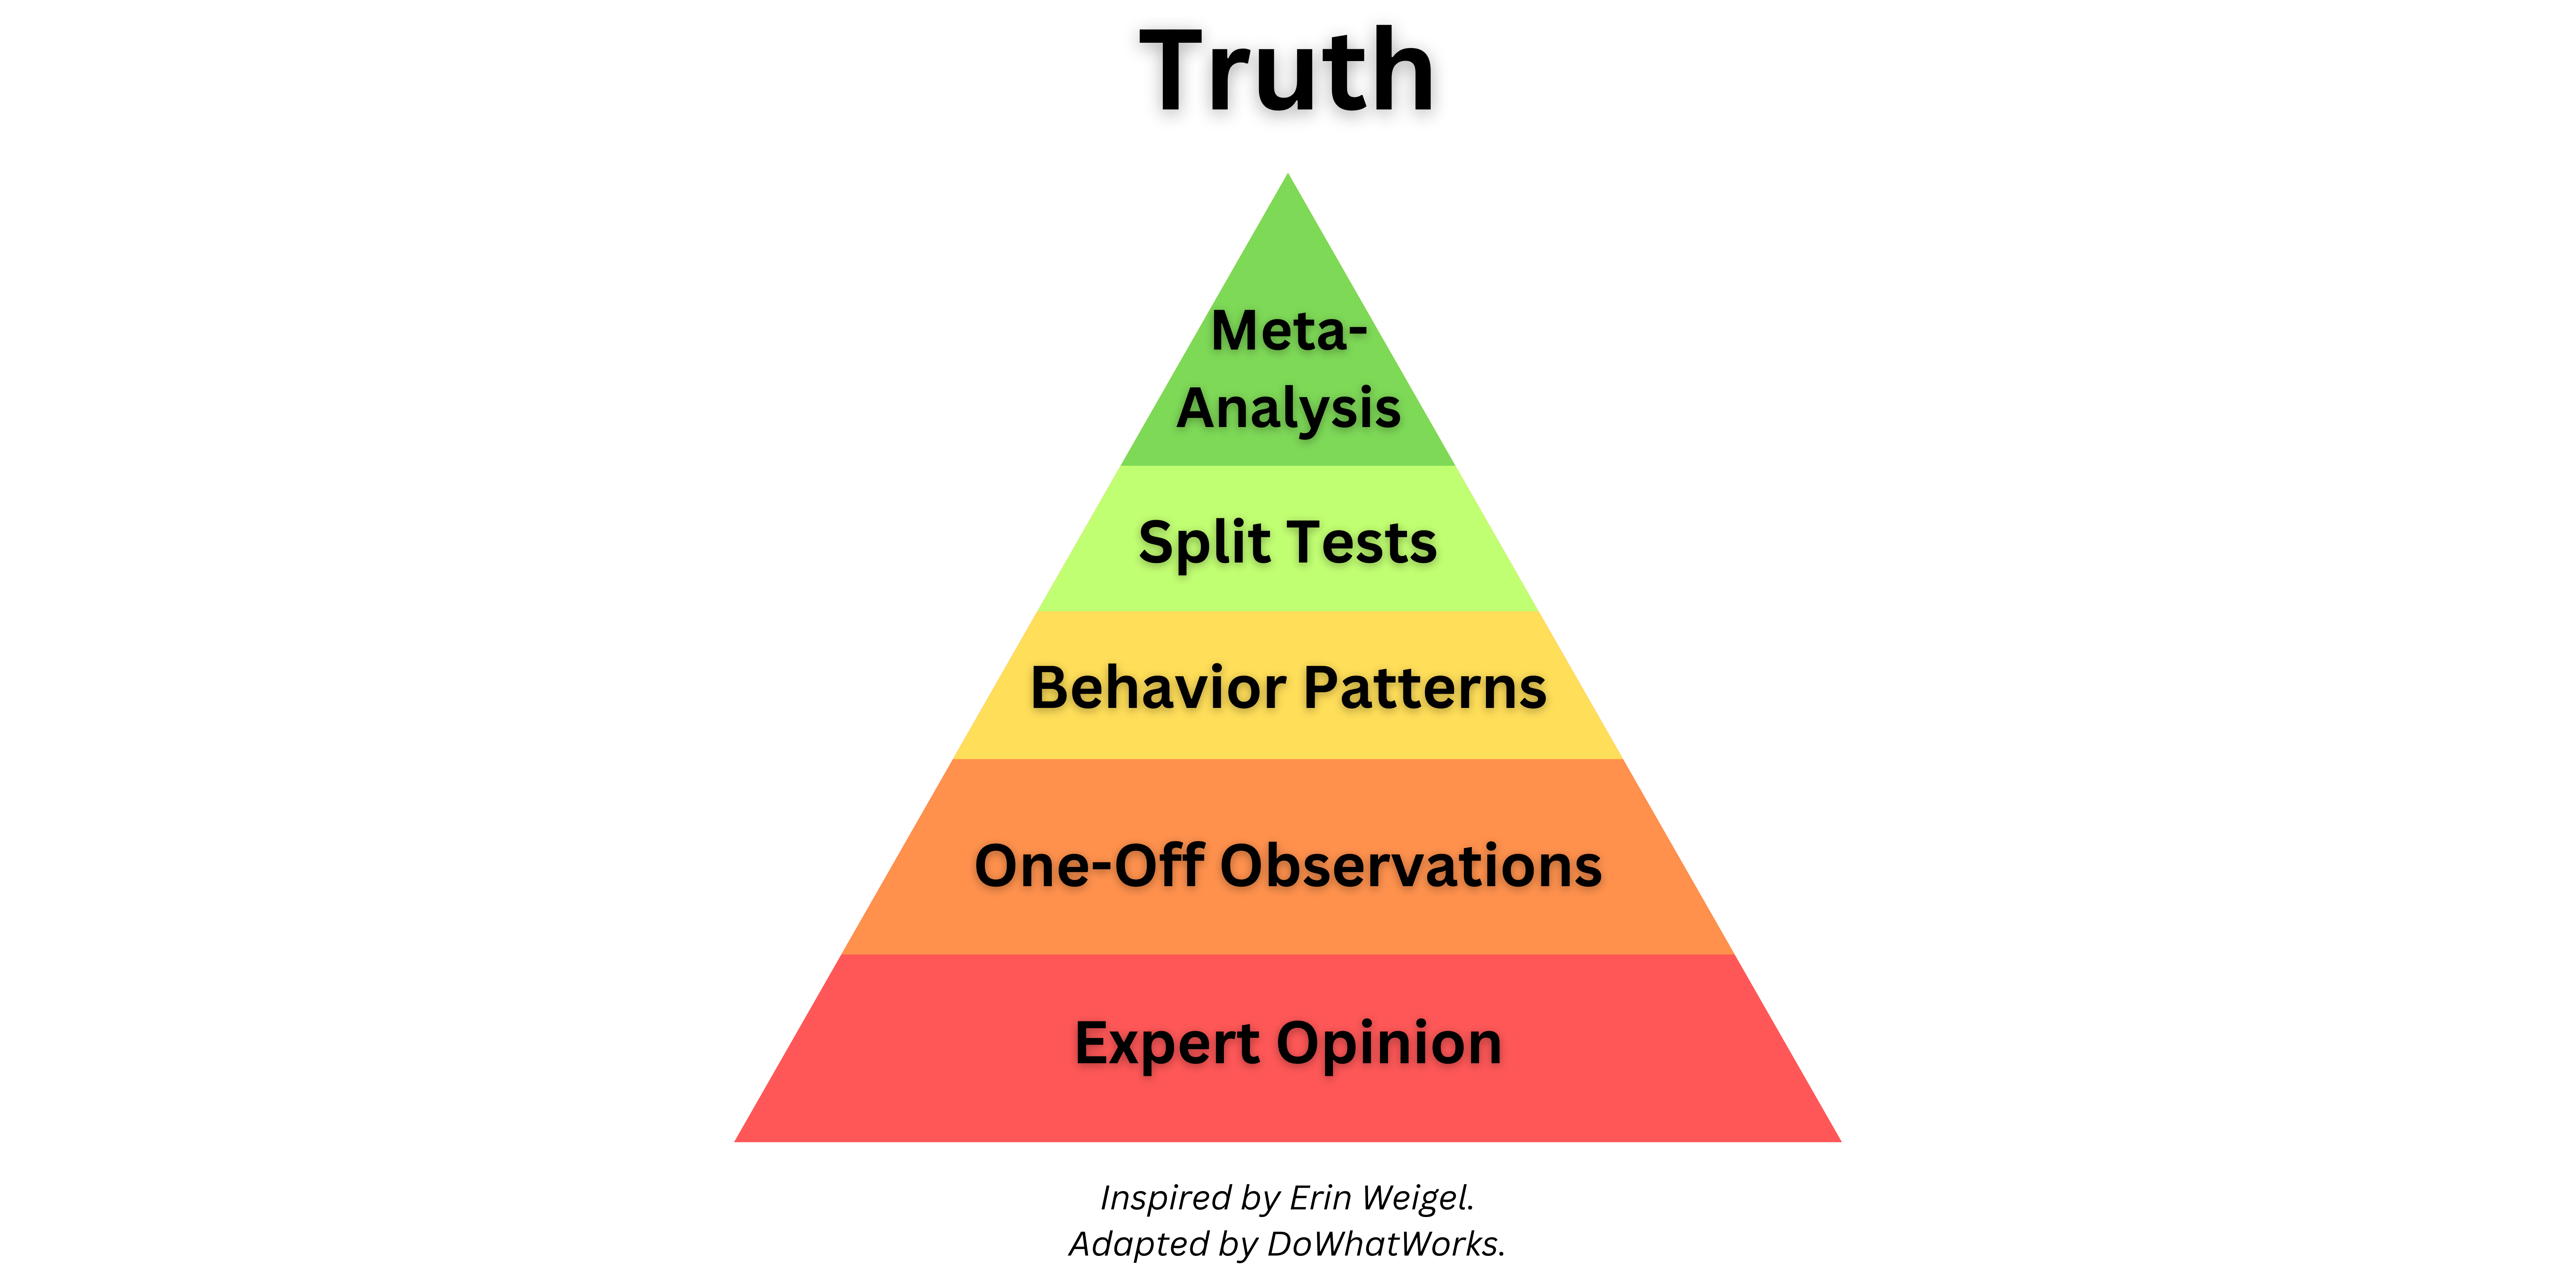
The hierarchy of evidence helps you organize qualitative and quantitative evidence to decide.
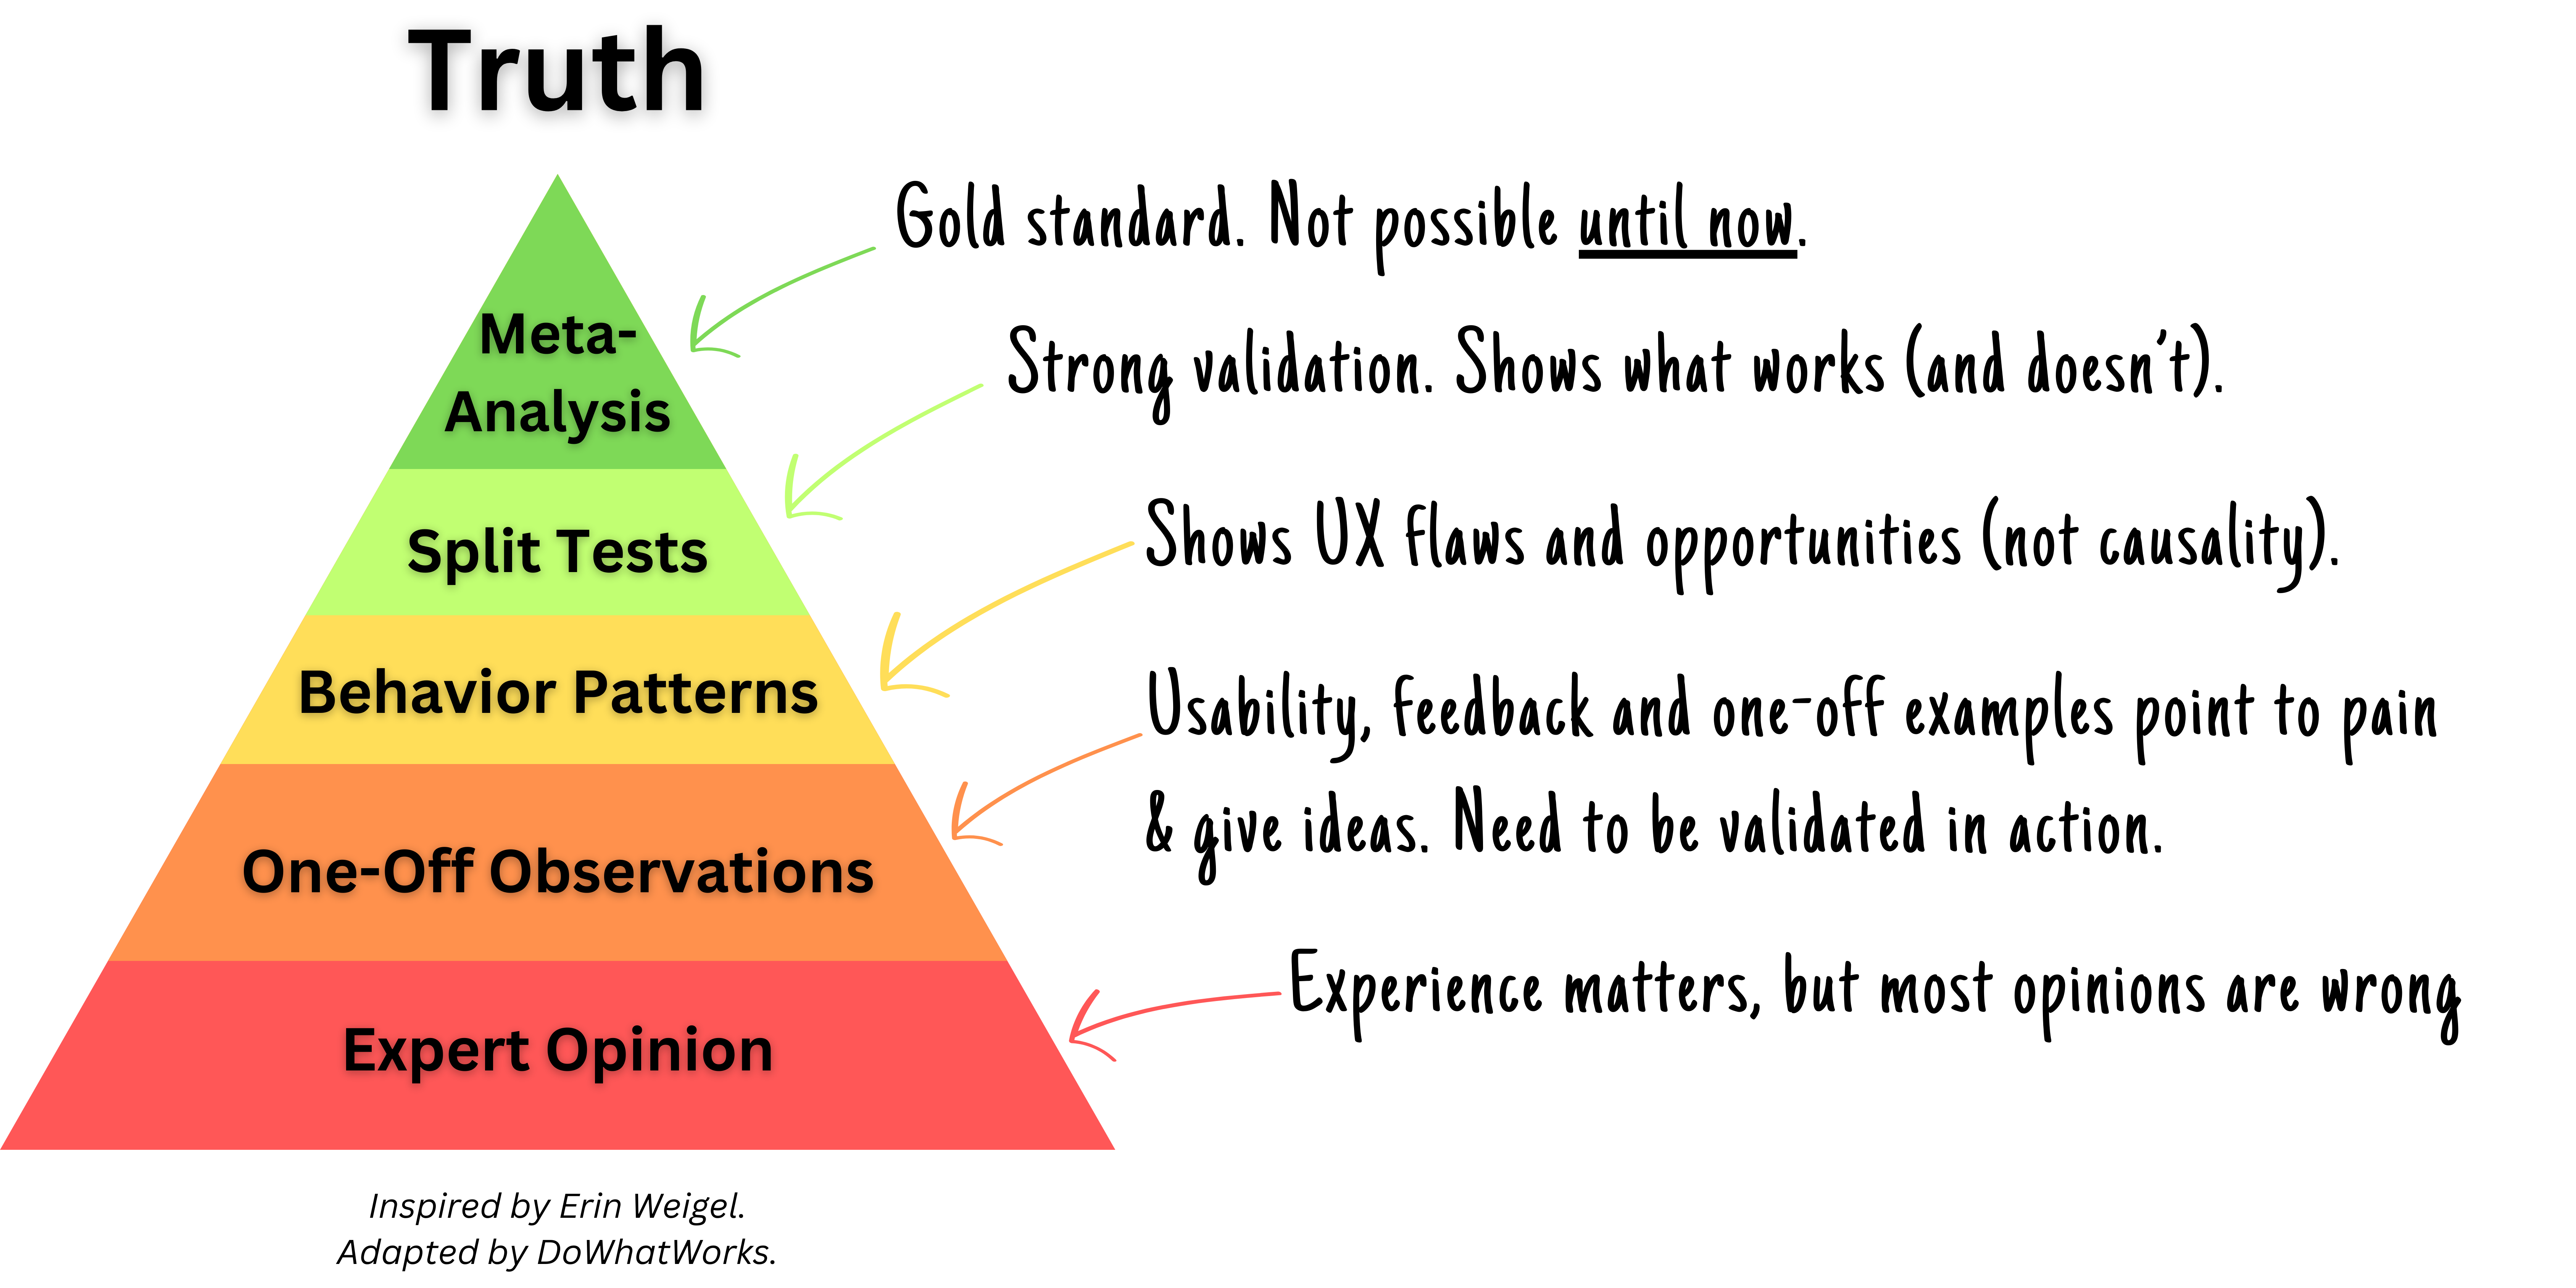
As you move up the pyramid, each method builds on the next. They do not replace each other. They collectively triangulate in on a bigger truth.
Expert gurus on LinkedIn will tell you social proof is a sure bet for success. But, how do you know for sure?
.png)
The short answer is you don’t. Experienced product managers, marketers and designers bring valuable insights to the table. But decisions based solely on personal intuition and expertise should be approached with caution.

When all you have is expertise (and no data to back it up) how do you choose who's expert opinion is correct? Odds are you will be forced to go with the Highest Paid Person’s Opinion (HiPPO). It can feel like your ideas are getting trampled. You can start to control your destiny and get wins that build momentum when you combine expertise with data. That’s where Level 2 comes in.
As you move up the stack, growth and product leaders use usability, feedback, customer interviews and anecdotal observations to guide the way.
.png)
These methods will provide fantastic insights on where users are stuck, confused, or feeling pain. Qualitative research can also reveal what users want to accomplish, but not how to solve it. For instance, interviews can reveal that users feel unease and need reassurance before requesting a demo. But qualitative feedback will not provide much guidance on whether social proof like star ratings will get people over the hump. Even if you included versions in usability sessions or asked users directly it would be hard for users to verbalize the impact social proof would actually have. Users are good at pointing out problems, but they’re not great at solving them. That’s your job.
.png)
On the whole, one-off observations may generate ideas and inspiration, but will be more useful when paired with behavioral data. What users actually do carries more weight than what they say they will do. To paraphrase Mike Tyson, you don’t actually know what works until you launch it.
.png)
By analyzing user interactions, navigation patterns, and engagement metrics, you can validate qualitative findings, gain a deeper understanding of where there are breaks in the product experience and grasp the magnitude of the problem (i.e. does it impact everyone or is it an edge case affecting few customers?). In our social proof example, behavioral data might show where large swaths of users are falling off (and could potentially use reassurance).
.png)
Unfortunately, behavioral data tends to be backwards-looking and doesn’t reveal causal relationships. You see how people move through an experience and how that changes when you change the experience, but you don’t actually know if the change you made caused the new behavior. If you add social proof on your fitness app’s marketing page on January 1, you will likely see adoption go up. Did it go up because of the brilliant changes you made? Or did it go up because people tend to exercise more in January?
You want to know if the change you made caused the results to change. To get causal evidence you need to move to Level 4.
If you want to know if social proof actually caused more conversions you need to test it.
By running controlled experiments (i.e. split testing, AB testing), you can actually determine if different types of social proof make a difference in getting people to adopt your experience. You can see the impact by page, location on page, geography, etc. and draw more robust conclusions about the impact of specific design choices.
.png)
When your tests win, you get a performance boost and insights on what works. When your tests lose or show no impact, it's hard to know if the idea or the execution was flawed. Execution matters (we’ve seen changing just 2 words generate millions of dollars). To really know if your concept will work with other treatments, you need to test again with different executions. Of course that will cost you time (typically 4+ weeks) and time equals money.
If you could, you’d want to run every possible permutation of a test. But that would take thousands of years. Instead you can lean on meta-analysis.
The strongest evidence comes from seeing many similar experiments produce consistent outcomes.
The more consistent the patterns that emerge, the more confidence you can have on where and how the evidence can be applied.
.png)
To do meta-analysis, you need data on a lot of experiments. If you could see thousands of tests involving every type of social proof on every type of page across sectors and geographies, then you’d know where it makes a difference and how.
Unfortunately, as you move up the pyramid in UX, the data becomes more scarce. Why?
1. Unlike medical science, results in UX experiments stay trapped inside the organization that ran them.
2. Individual companies lack the resources and the desire to repeatedly run similar tests (especially ones that don't produce lift). They are more likely to give up on an idea rather than test multiple executions.
We're changing the game.
Until now, no one has had access to data for tests for all companies in a given sector, so no one has been able to do meta-analysis.
At DoWhatWorks, we've unlocked the ability to view the randomized controlled trials being run by any company.
Really.
When we launched, growth teams were shocked they could see individual tests run by competitors or companies they admired. They were finally able to use other brands' test results for inspiration for what to do and how.
.png)
(If you'd like to see this full test in our dashboard, click here to sign up for our newsletter and to receive instant free access.)
Years later our patented engine has identified over 19,000 tests (and counting). At this scale, you can finally do meta-analysis to reveal powerful insights about how likely concepts are to work (by sector, geography, page, layout, etc).
We’ve been rolling out early versions of our meta-analysis with customers over the last year. Our clients use our meta-analyses before they test - to save years of wasted testing and hone in on what works faster. So far we're seeing multimillion dollar lifts in results.
We've analyzed over 2,500 tests focused on social proof (ie. testimonials, logos, press hits, stars, awards, etc). We can see that social proof is not a universal winner. Where and how it's executed make a huge difference. It's a pretty big dud in a lot of contexts.
Stay tuned for exciting announcements on this soon. In the meantime, if you want to see the power of a DoWhatWorks meta-analysis, get in touch.
We are thrilled that product and growth teams can now get access to the volume of experiments needed to unlock meta-analysis for the industry.
Collectively, product and growth teams spend millions of dollars every year pursuing conventional wisdom. Meta-analysis reveals where conventional wisdom is often wrong, and we see that conventional wisdom is wrong a lot. We've finally completed the pyramid to help teams unleash massive creativity in the years ahead.
A final note... It’s important to remember that one type of evidence is not better than the others. You can’t get to the top of the pyramid without climbing past the base. Expertise gives you the ability to know what types of qualitative data to use and how. Behavioral data puts qualitative insights in context and validates that fixing an issue could make a difference. Split tests give you a true read on causality. Meta-analysis provides the most complete picture of what types of things work by sector, geo, page, etc. Each level builds on the ones below to create a picture of what actually makes a difference, where and how.